PyMOL Beginner’s Guide, Pt. 2
June 29, 2020 ☼ PyMOL ☼ Modeling ☼ Guides ☼ Proteins
Welcome to Part 2 of the PyMOL Beginner’s Guide! If you are brand new to PyMOL and haven’t worked through Part 1 of this guide, I recommend working through that part before starting this section.
In Part 2, I will introduce four additional modeling tools within PyMOL and the special case of visualizing binding surfaces. These tools build upon the skills from Part 1 and enable you to tackle complex modeling questions.
Table of Contents
- Finding Polar Contacts
- Measuring Distances
- Aligning Objects
- Visualizing Binding Surfaces
- Modeling Mutations
Hands-on Exercise Step: For Part 2, we will be working with two crystal structures of the SARS-CoV-2 receptor-binding domain (RBD). The first crystal structure is a trimer with two protomers1 in the “down” position (PDB: 6VSB)2. To prepare for the remaining steps in this guide, extract chains A (up conformation) and chain B (down conformation) into separate objects. Chain C is not required for this guide.
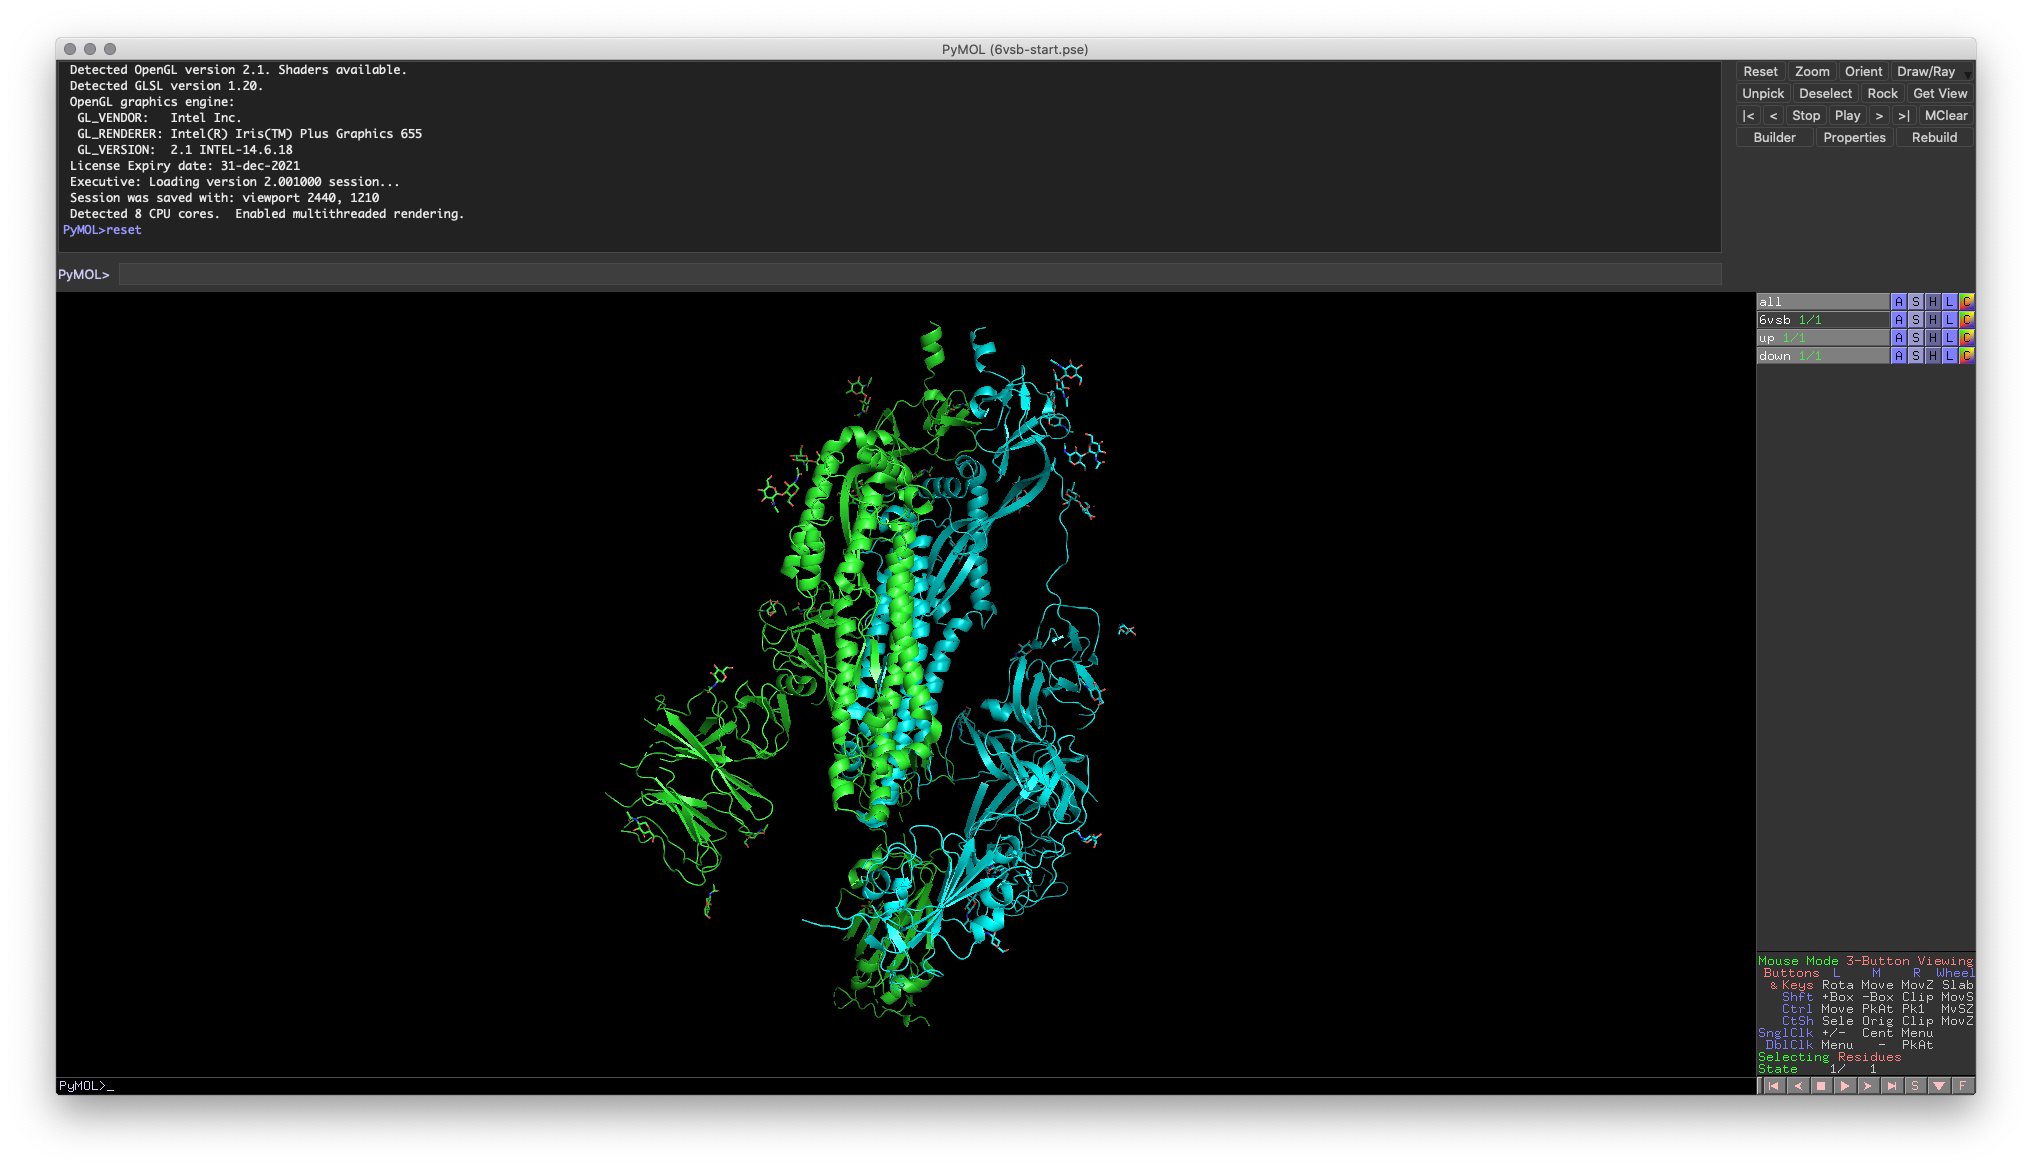 Fig. 1: Example of correct PyMOL setup for the next few exercises
Finding Polar Contacts
A typical modeling question, especially when looking at ligand binding or protein-protein interactions, is to find potential polar contacts or hydrogen bonding. In some cases, you may feel comfortable looking for these types of bonds by eye, based on geometry and an intuitive feel about distance. However, PyMOL can also offer some automatic detection of potential polar contact to help.
To illustrate this functionality, let’s take a look at the small helix next to the N-acetylglucosamine molecule on the RBD (around residue 340).
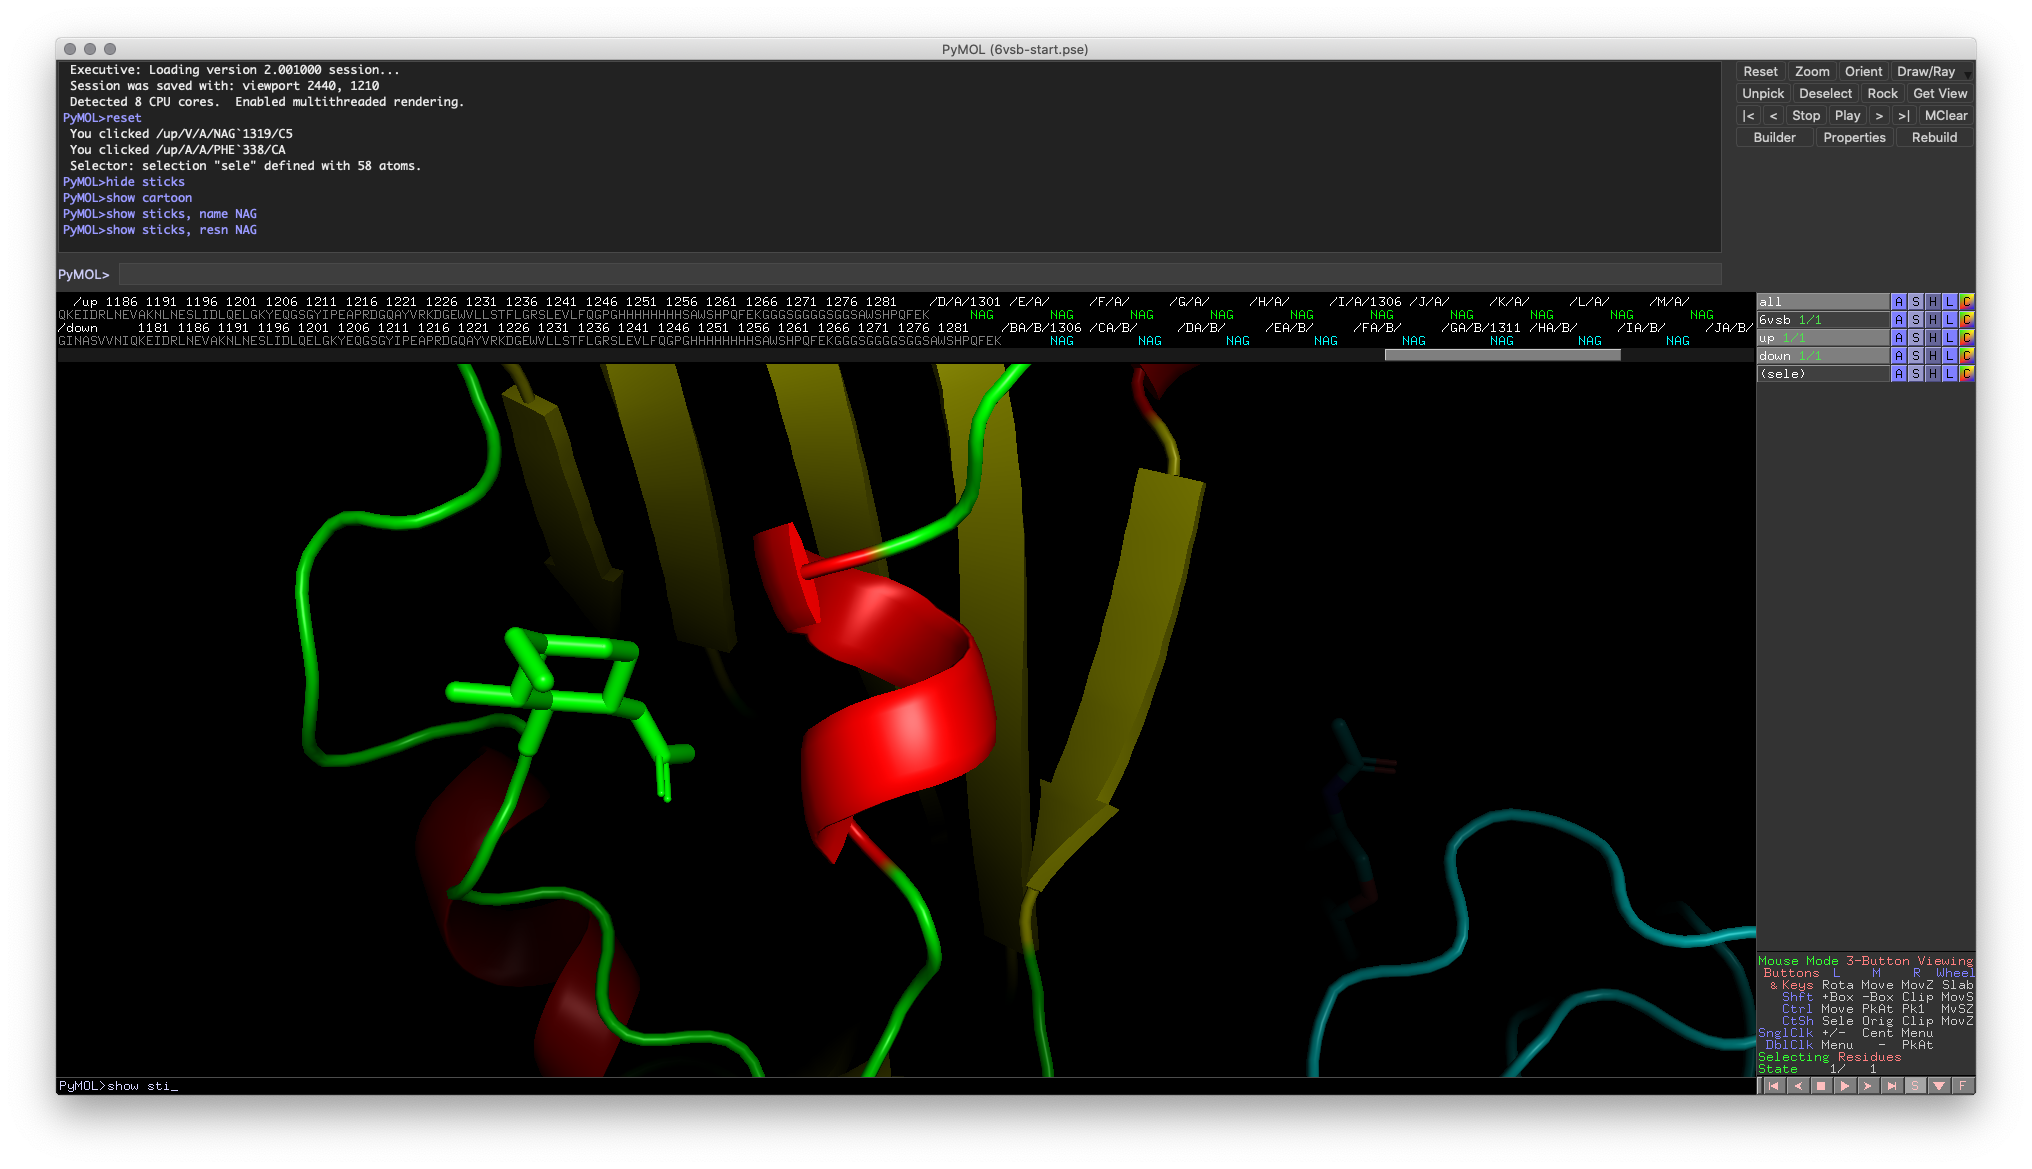 Fig. 2: Helix of interest on the RBD
If you have some background with protein structure, you may intuitively see the hydrogen bonding pattern amongst the backbone atoms that are consistent with helical secondary structures (don’t worry if you don’t!). Now, with the residues in the helix selected (I’ve created a named selection, “helix1”), you can use the action button in the Objects and Selections pane or right-click the selection in the Visualization Window (my preferred way) to access the “find” function. You then choose “polar contacts” and then the potential selection space. PyMOL will automatically create dashed yellow lines between atoms that have a possible polar contact!
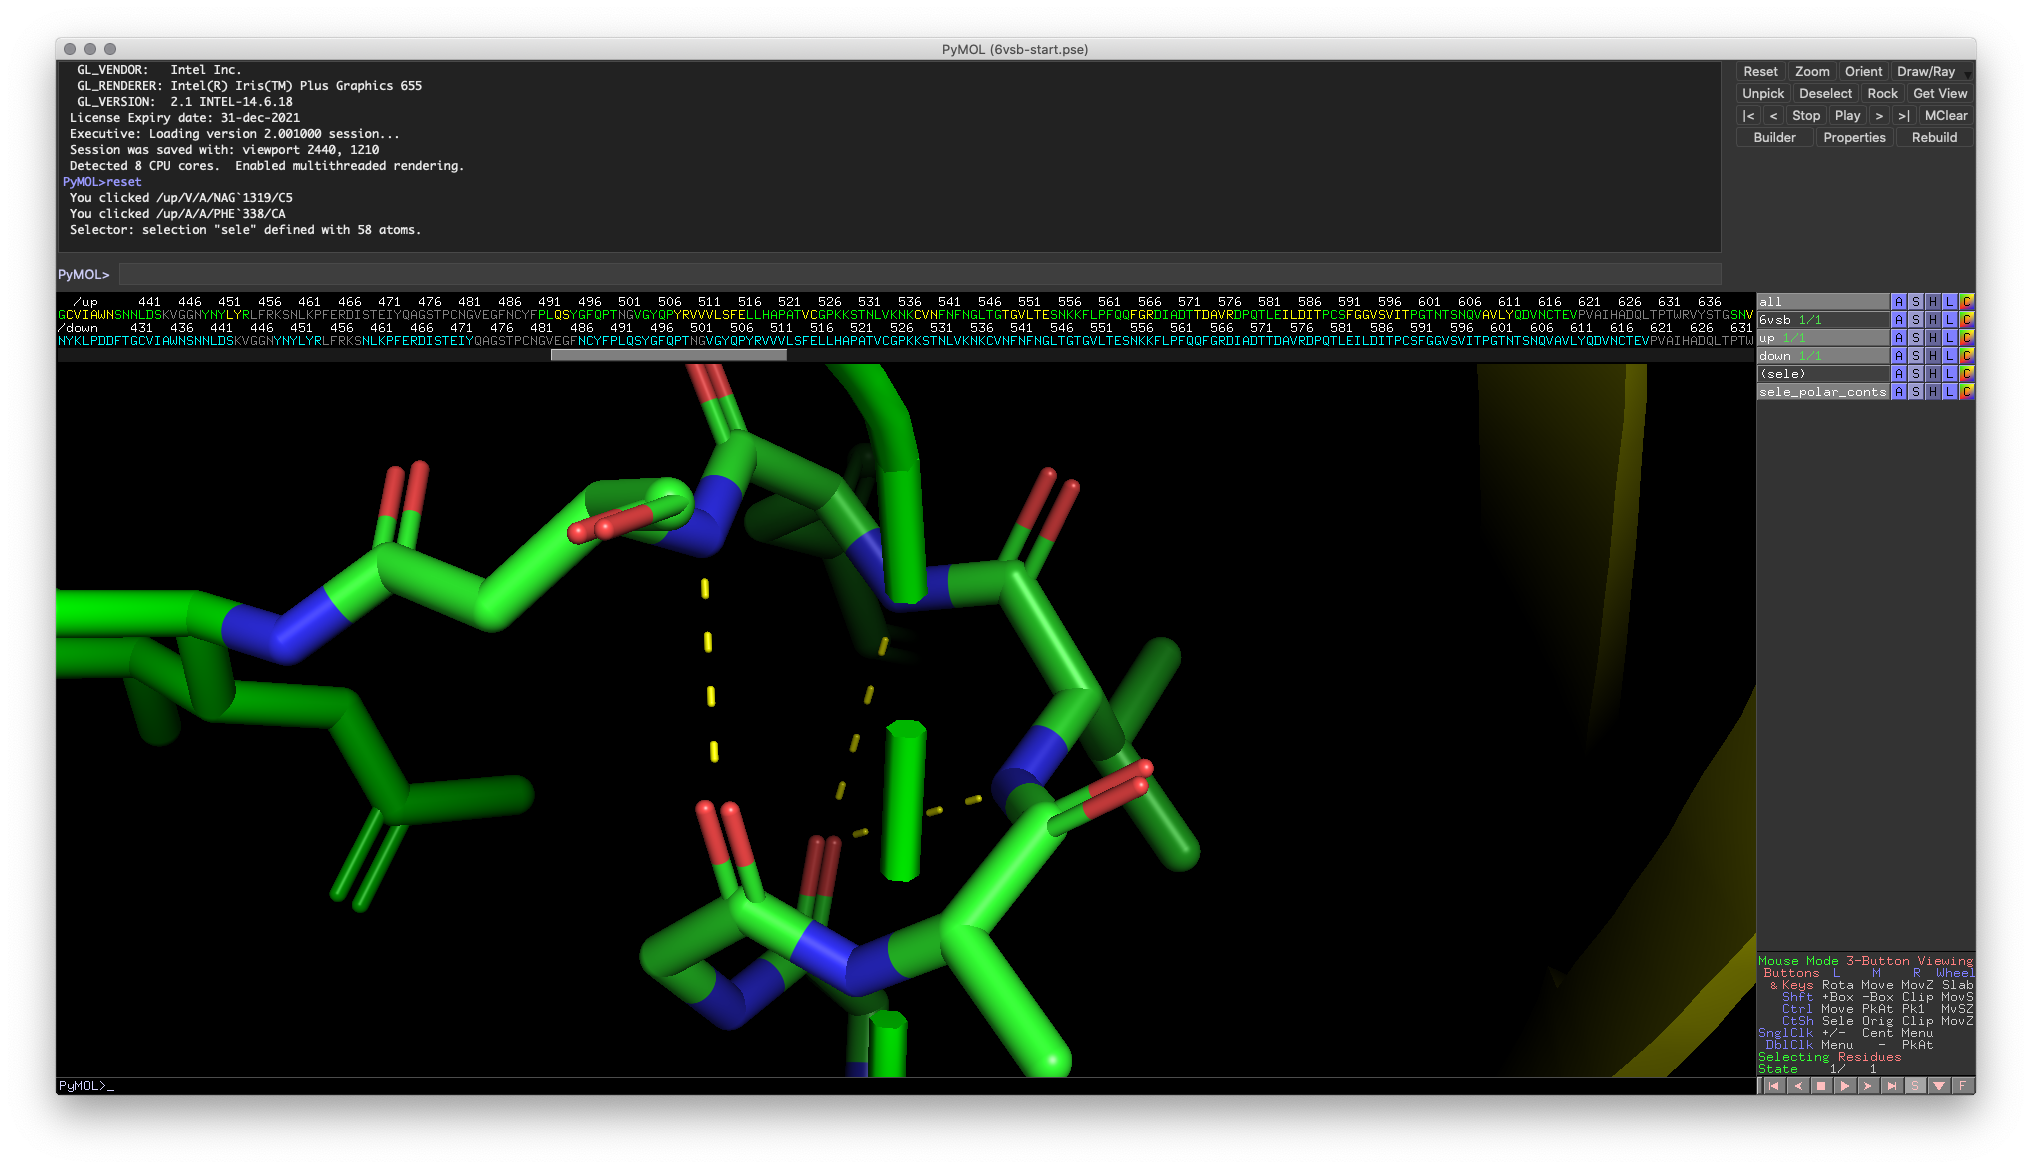 Fig. 3: Polar contacts in target helix
In most cases, these identified polar contacts should match with your expectations (generally, hydrogen bonds require a linear geometry). However, some identified contacts don’t look correct and are most likely not real hydrogen bonds. These incorrectly identified contacts highlight a crucial part of modeling: modeling always comes with some limitations, and you must use your prior knowledge to interpret the results accurately.
Hands-on Exercise 1: Find the polar contacts connecting the two 𝛽-strands next to the helix we worked with above (around residues 355 and 395).
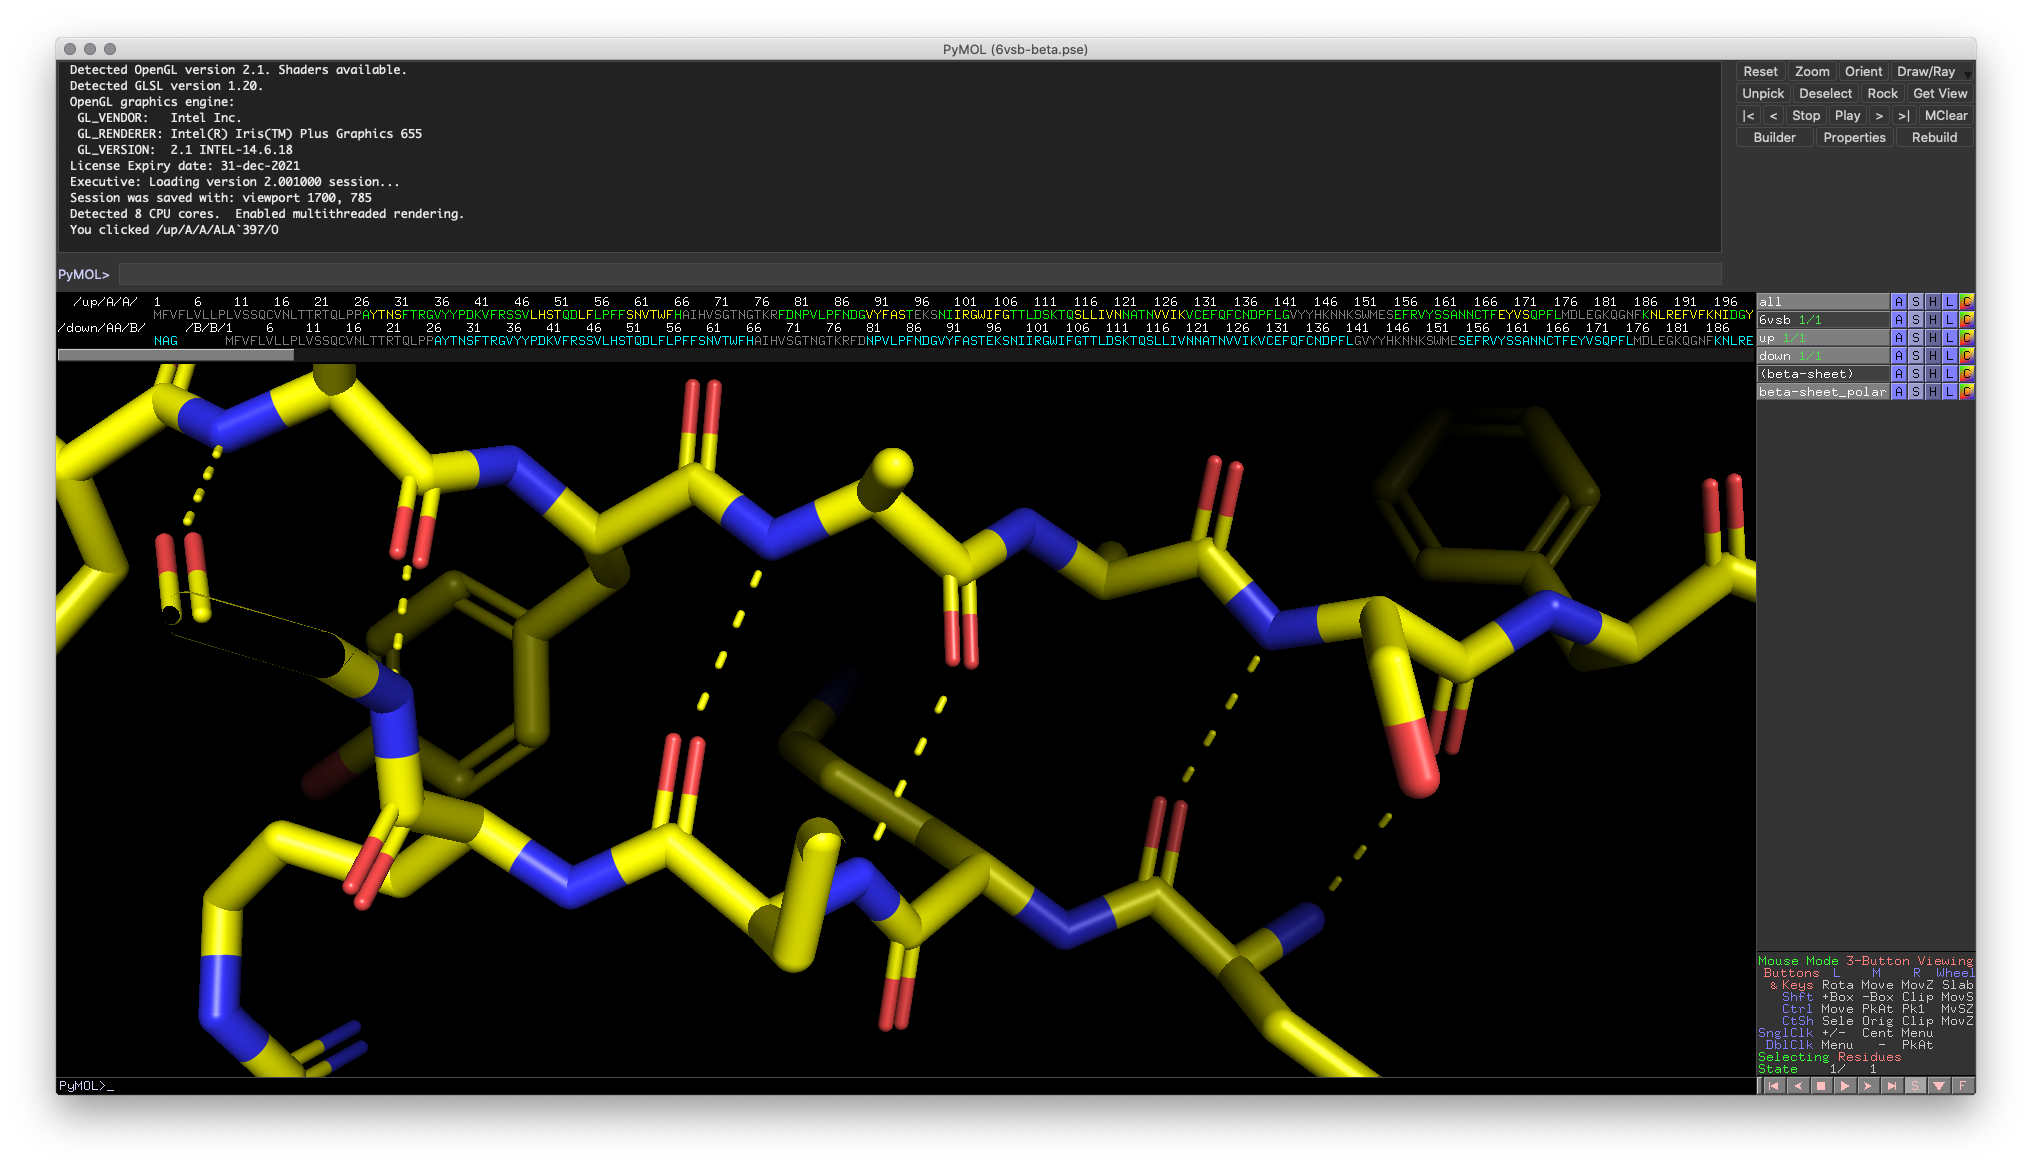 Hands-on Exercise 1: PyMOL window illustrating polar contacts with the target 𝛽-strands
Measuring Distances
PyMOL can also be used to measure distances between atoms. This functionality is great if you’re looking to engineer binding pockets, checking for potential steric clashes, or even double-checking the geometries of hydrogen bonds. To access measurement tools:
- Change your mouse selection to “Atom”
- Go to the menu bar and select “Wizard”
- Select “Measurement”
After selecting “Measurement,” you’ll see the measurement wizard show up at the bottom of the Objects and Selections Pane, along with a step prompt in the top left of the Visualization Window. To measure the distance between two atoms, select the first atom, and then select the second. Dashed lines will appear in the Visualization Window with a distance (in angstroms) label at the center.
Hands-on Exercise 2: Measure the distance between hydrogen bond pairs between the 𝛽-strands we explored in Exercise 1.
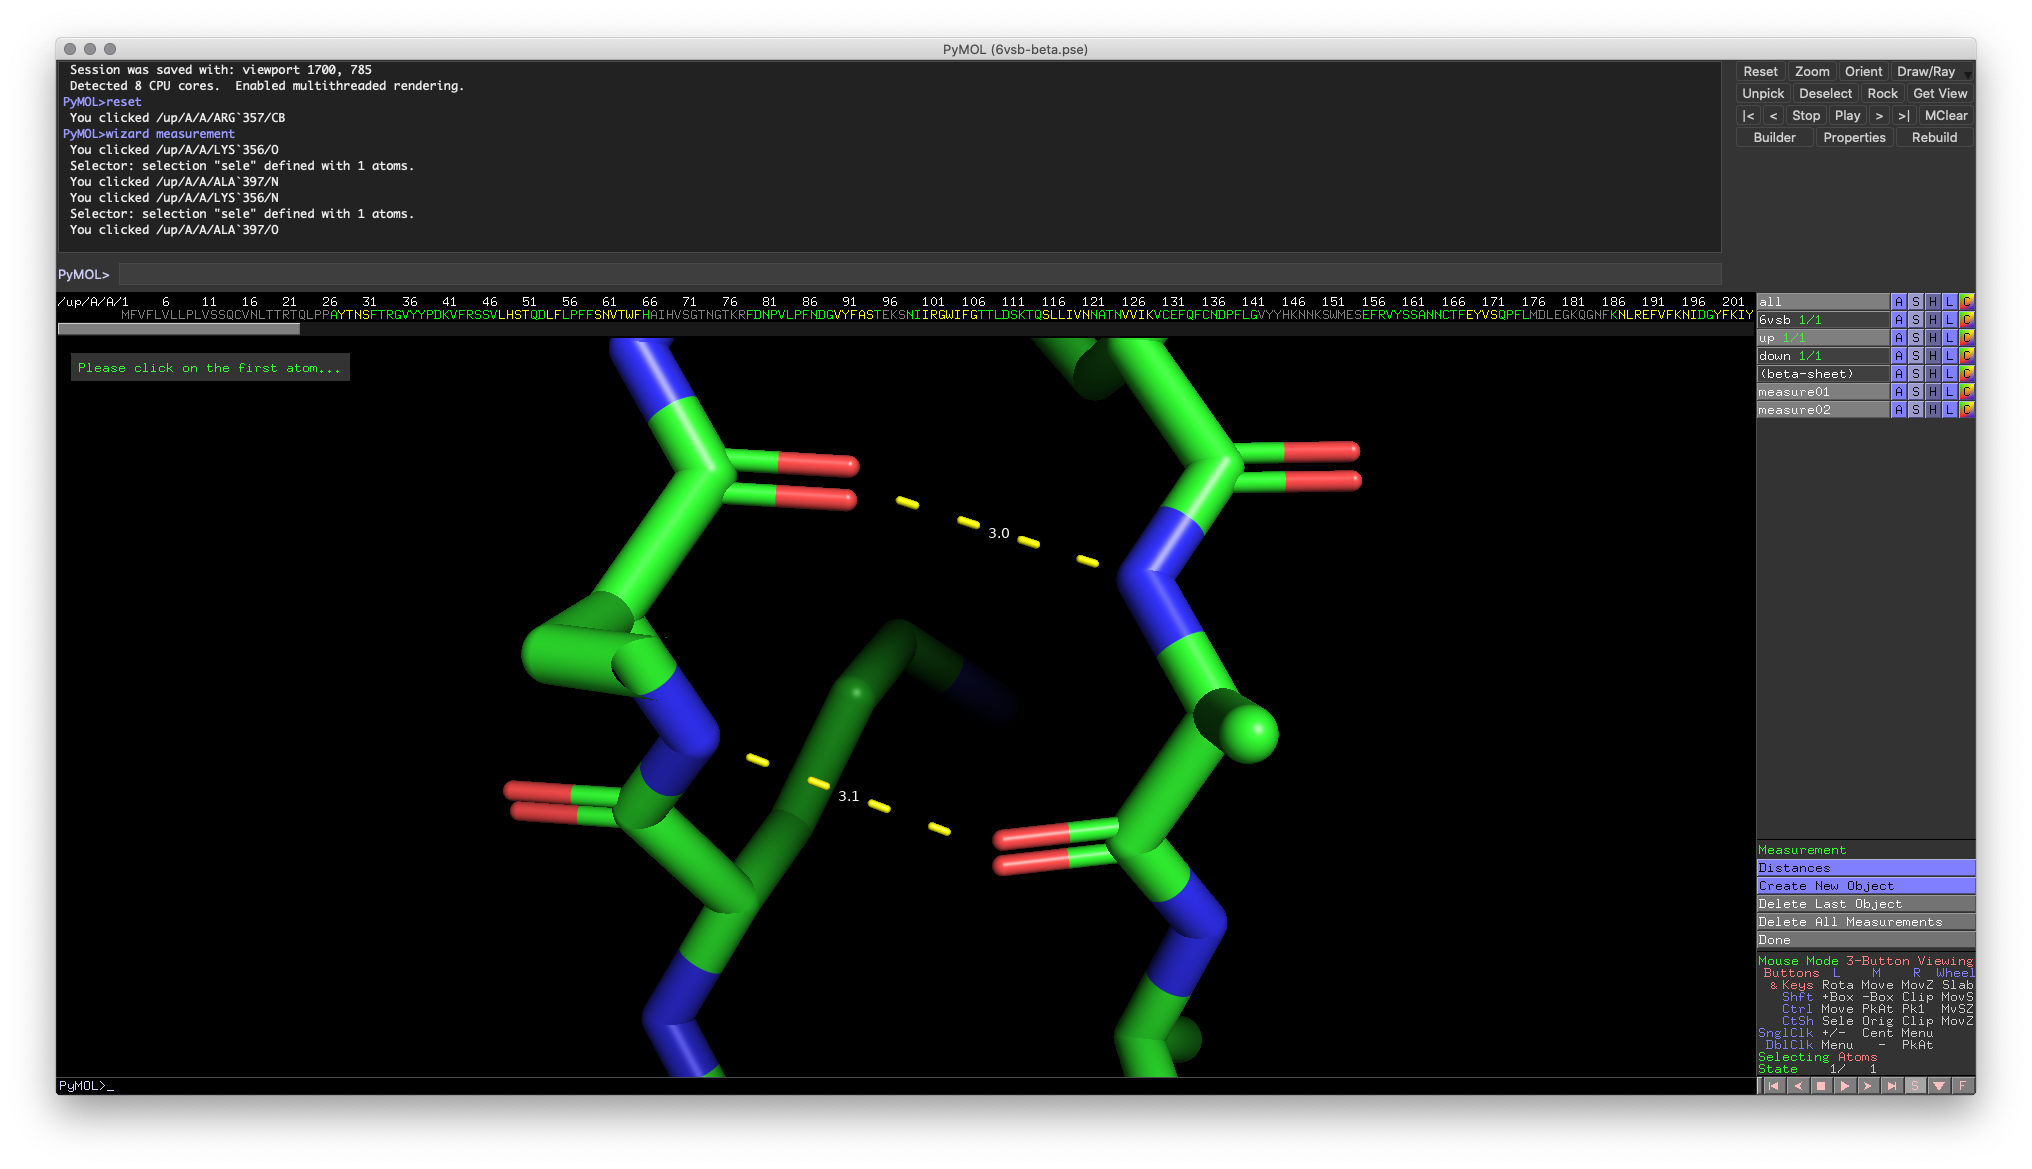 Hands-on Exercise 2: PyMOL window illustrating some potential distances between hydrogen bonding pairs.
Aligning Objects
Sometimes, we’re interested in comparing the structures of two proteins. For some applications, analyzing the primary structure (the amino acid sequence) may be enough to test or confirm structural hypotheses. However, comparing solved structures can provide vital information about functional relationships, especially for proteins that can take on multiple conformations.
One way to conduct structure comparisons is to align the structures using PyMOL. To execute this process, PyMOL minimizes the root mean square deviation (RMSD) between the two structures. In other words, PyMOL moves one of the structures through 3D space to minimize the distances between atoms in the two structures.
To do this in PyMOL, you can use the align command:
# Align Command
align {mobile-target}, {stationary-target}

# NOTE: This only works for entire objects, not selections

### Example ###

# Aligns Object 1 and 2 by moving Object 1 over Object 2
align object1, object2
Hands-on Exercise 3: Align the “Up” and “Down” conformation RBDs. You should notice that the majority of the RBD has good alignment, except for a small domain.
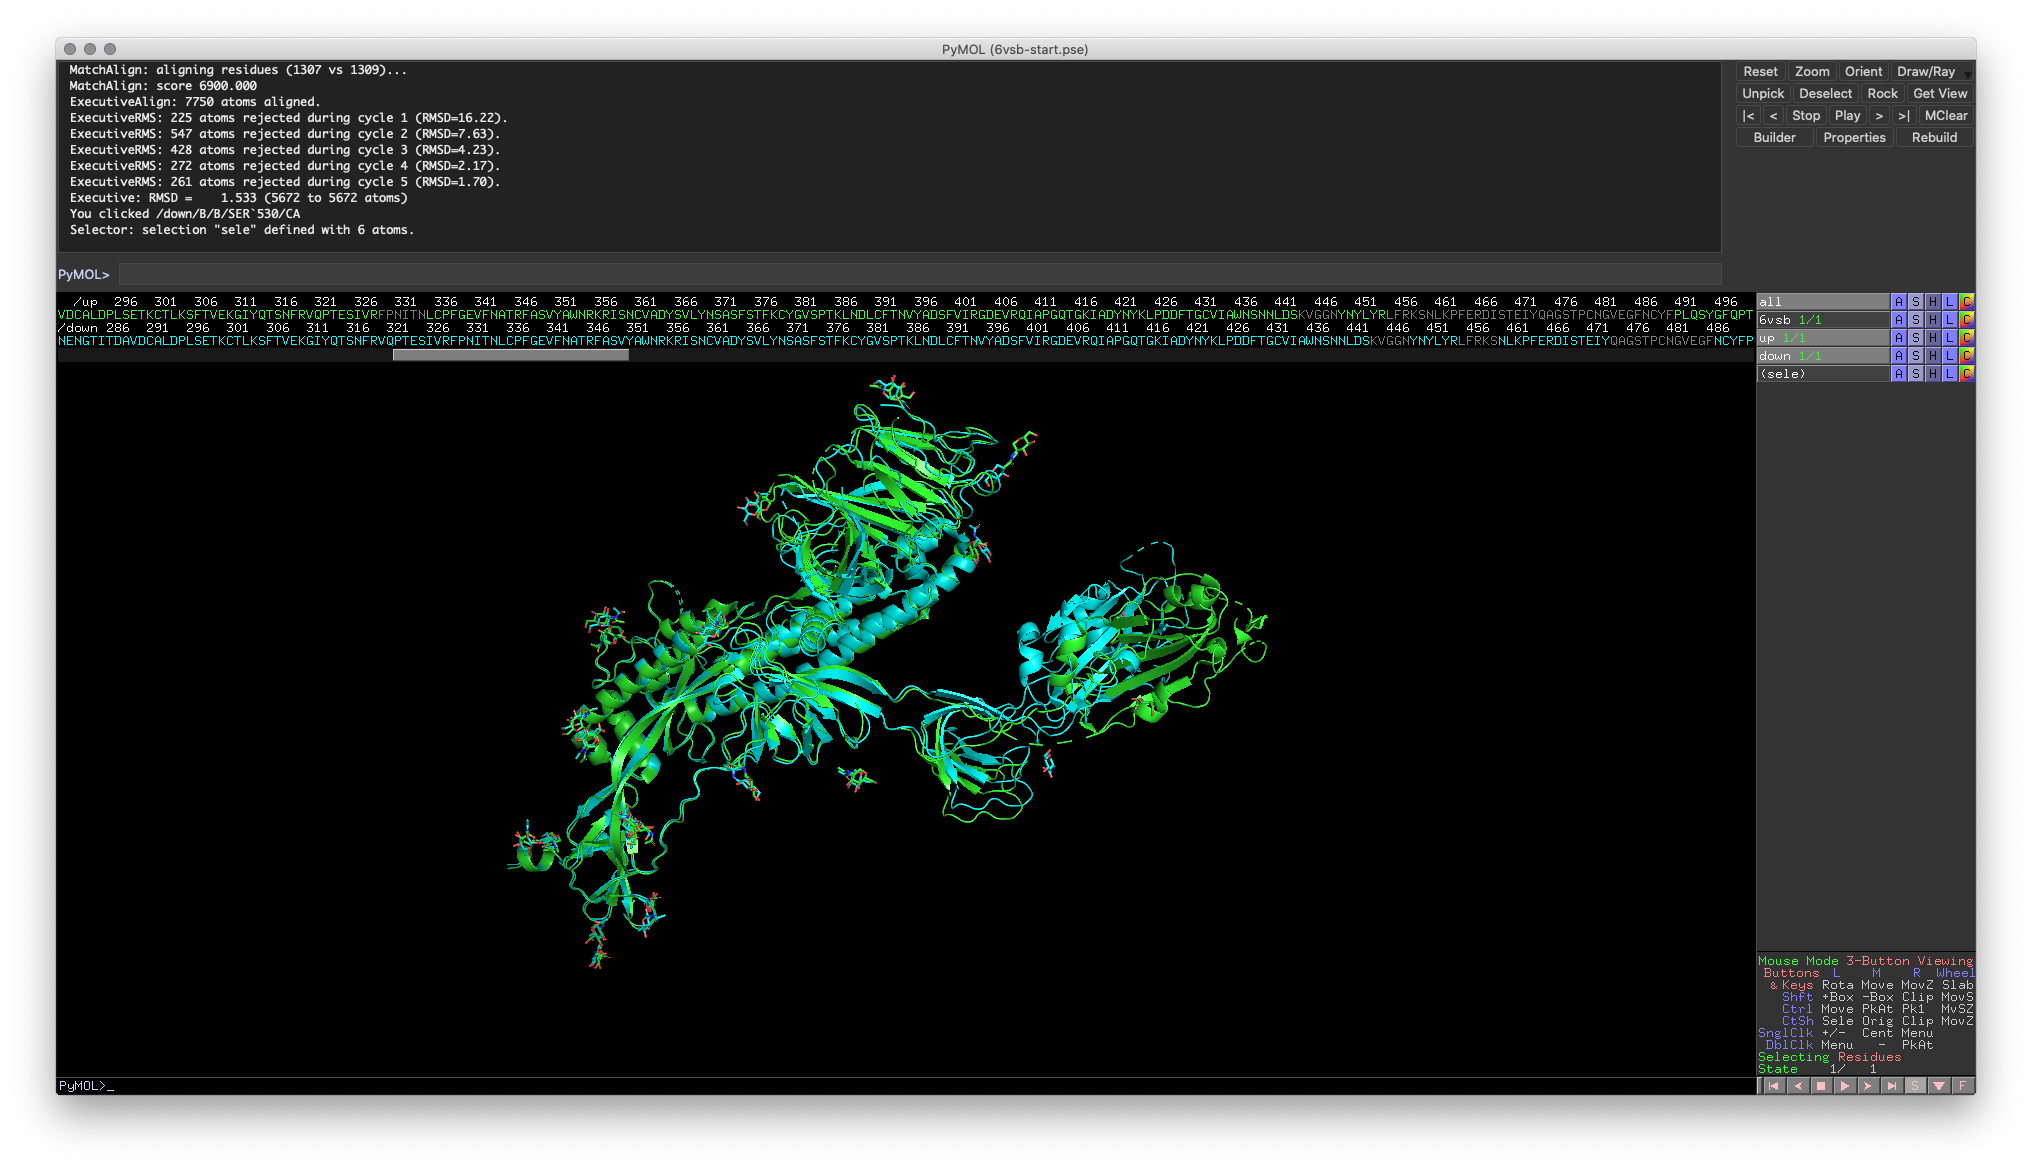 Hands-on Exercise 3: PyMOL window illustrating RBDs that are correctly aligned.
Visualizing Binding Surfaces
PyMOL can also help you visualize binding surfaces. This is particularly helpful for visualizing protein-protein interactions or protein-ligand interactions. While you may think it’s as simple as turning on the surface representation, there is an extra step to the process that is often forgotten.
Hands-on Exercise Step: For the next two sections, we will be working with the second SARS-CoV-2 structure. This structure contains the RBD bound to its receptor, ACE2 (PDB: 6LZG)3. Load in this structure into PyMOL, color it by chains, and remove the waters.
As mentioned in the introductory paragraph, one of the most common mistakes when visualizing binding surfaces for the first time is to turn on the surface representation for the entire object. If you do this, you’ll end up with a surface visualizing that combines the surfaces of the two molecules.
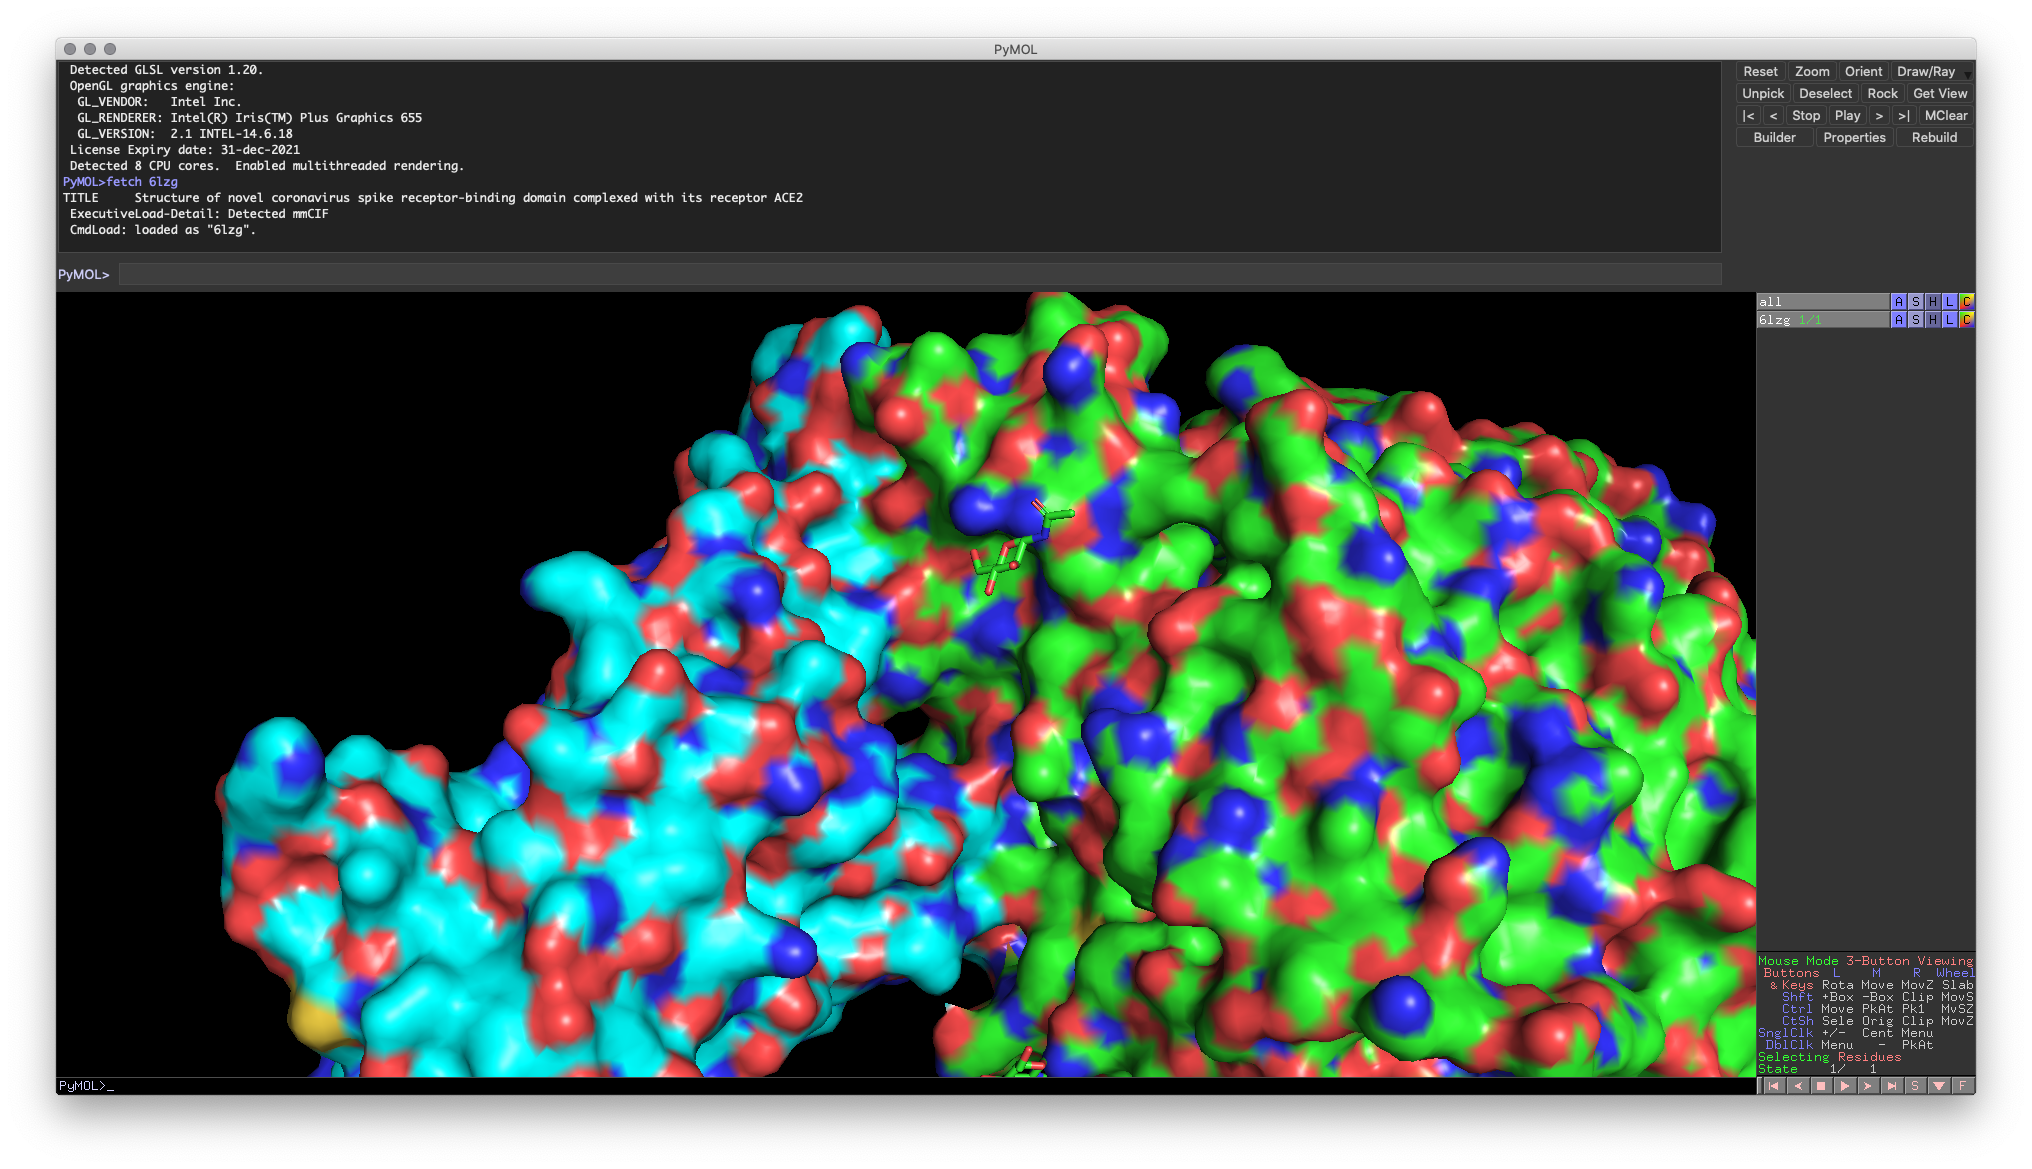 Fig. 4: Incorrect combined surface representation does not allow you to visualize the binding surface accurately
Instead, you need to separate the chains into their own objects so that PyMOL knows not to combine their surfaces.
Hands-on Exercise 4: Separate the two chains (Chain A: ACE2, Chain B: RBD) and turn on the surface representation. You’ll then see the proper binding surfaces for each molecule.
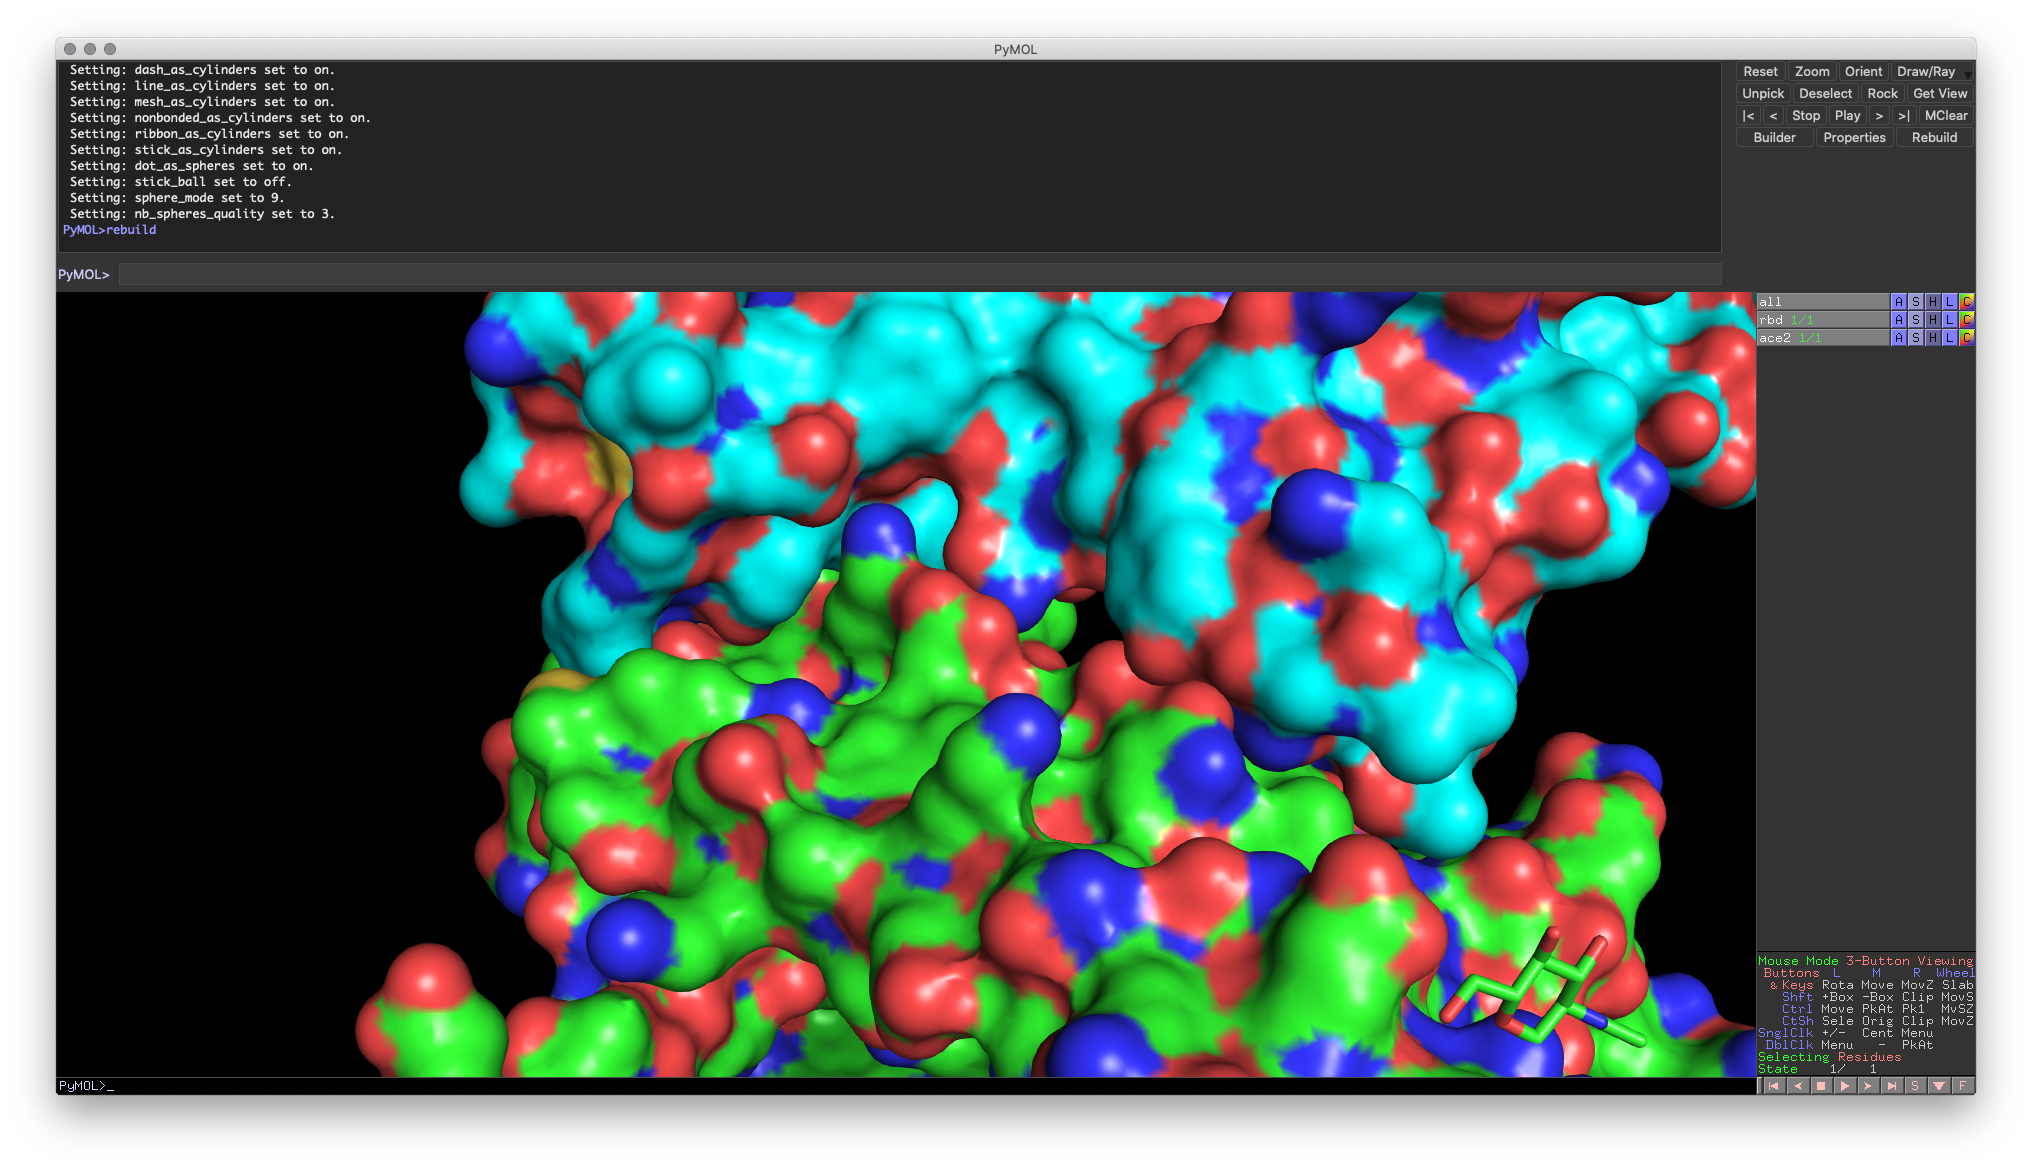 Hands-on Exercise 4: PyMOL window illustrating proper binding surface representation.
Modeling Mutations
The last tool that will be introduced in this guide is the mutagenesis tool. This tool will enable you to model mutations directly in PyMOL, an important part of any protein engineering project. While PyMOL will not adjust the overall structure in response to the modeled mutation, it can help you visualize what mutations may work or are most likely to fail.
To walk you through the mutagenesis tool, we’re going to focus on one residue that’s part of the RBD/ACE2 binding surface: Leu455 on the RBD.
Hands-on Exercise Step: Reinitialize PyMOL and fetch 6LZG again. Then, create a new selection around Leu455 (expand by 6Å)on the RBD and visualize the residues as sticks. Recoloring Leu455 may also help with this exercise.
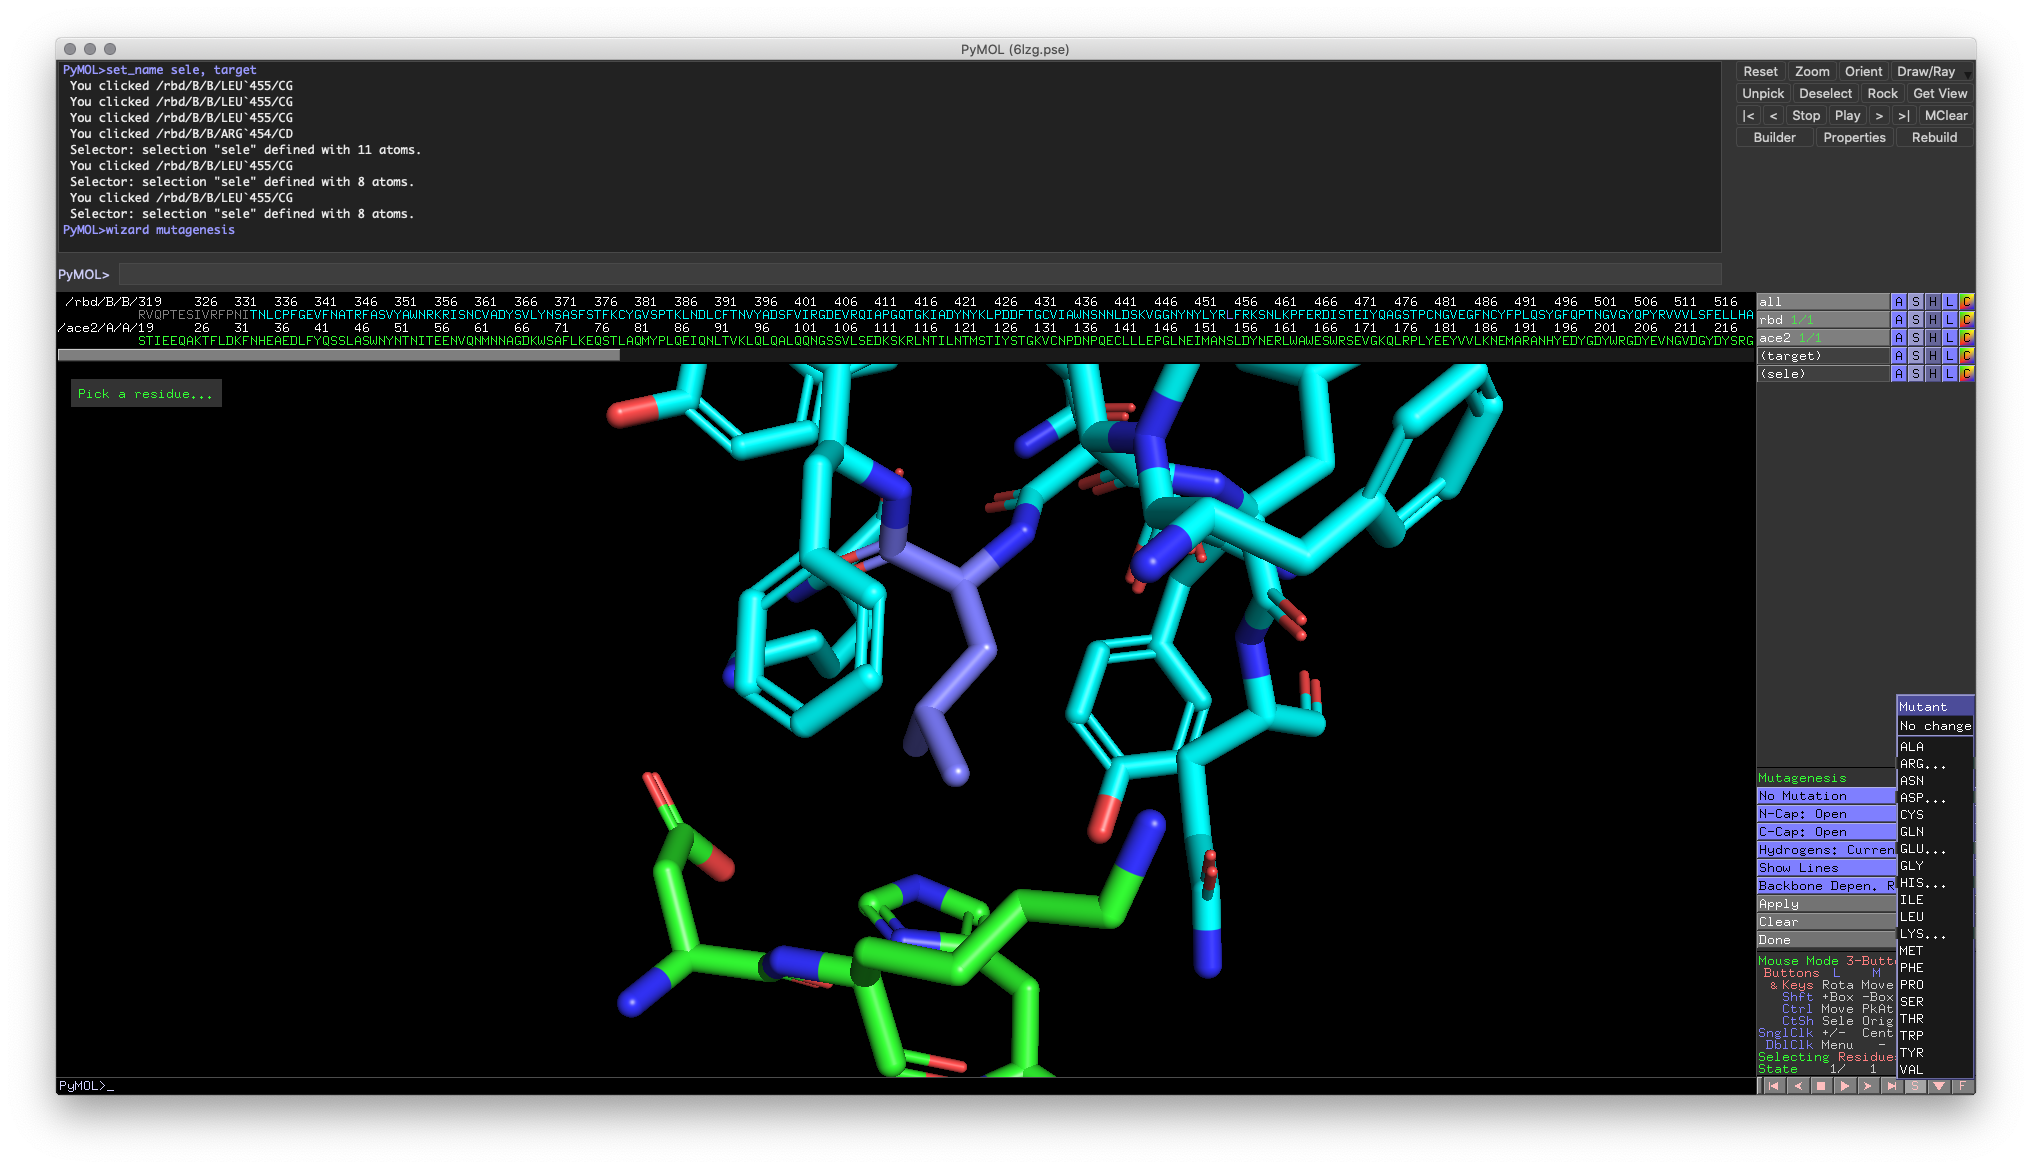 Fig 5: One view of the proper visualization around Leu455
To access the mutagenesis tool:
- Go to the menu bar and select “Wizard” (same as the distance tool)
- Select “Mutagenesis” and select “Protein”
Like the measurement tool, a new menu UI will appear at the bottom of the Objects and Selections pane. The button to focus on is the top blue button that initially reads “No Mutation.” When you click on this button, it will bring up a list of amino acids (three-letter code). To select the mutation, select one of the amino acids from the list (E.g., TRP for tryptophan). This will change the top button to indicate the current mutation. To model a mutation, you select the target residue in the visualization window.
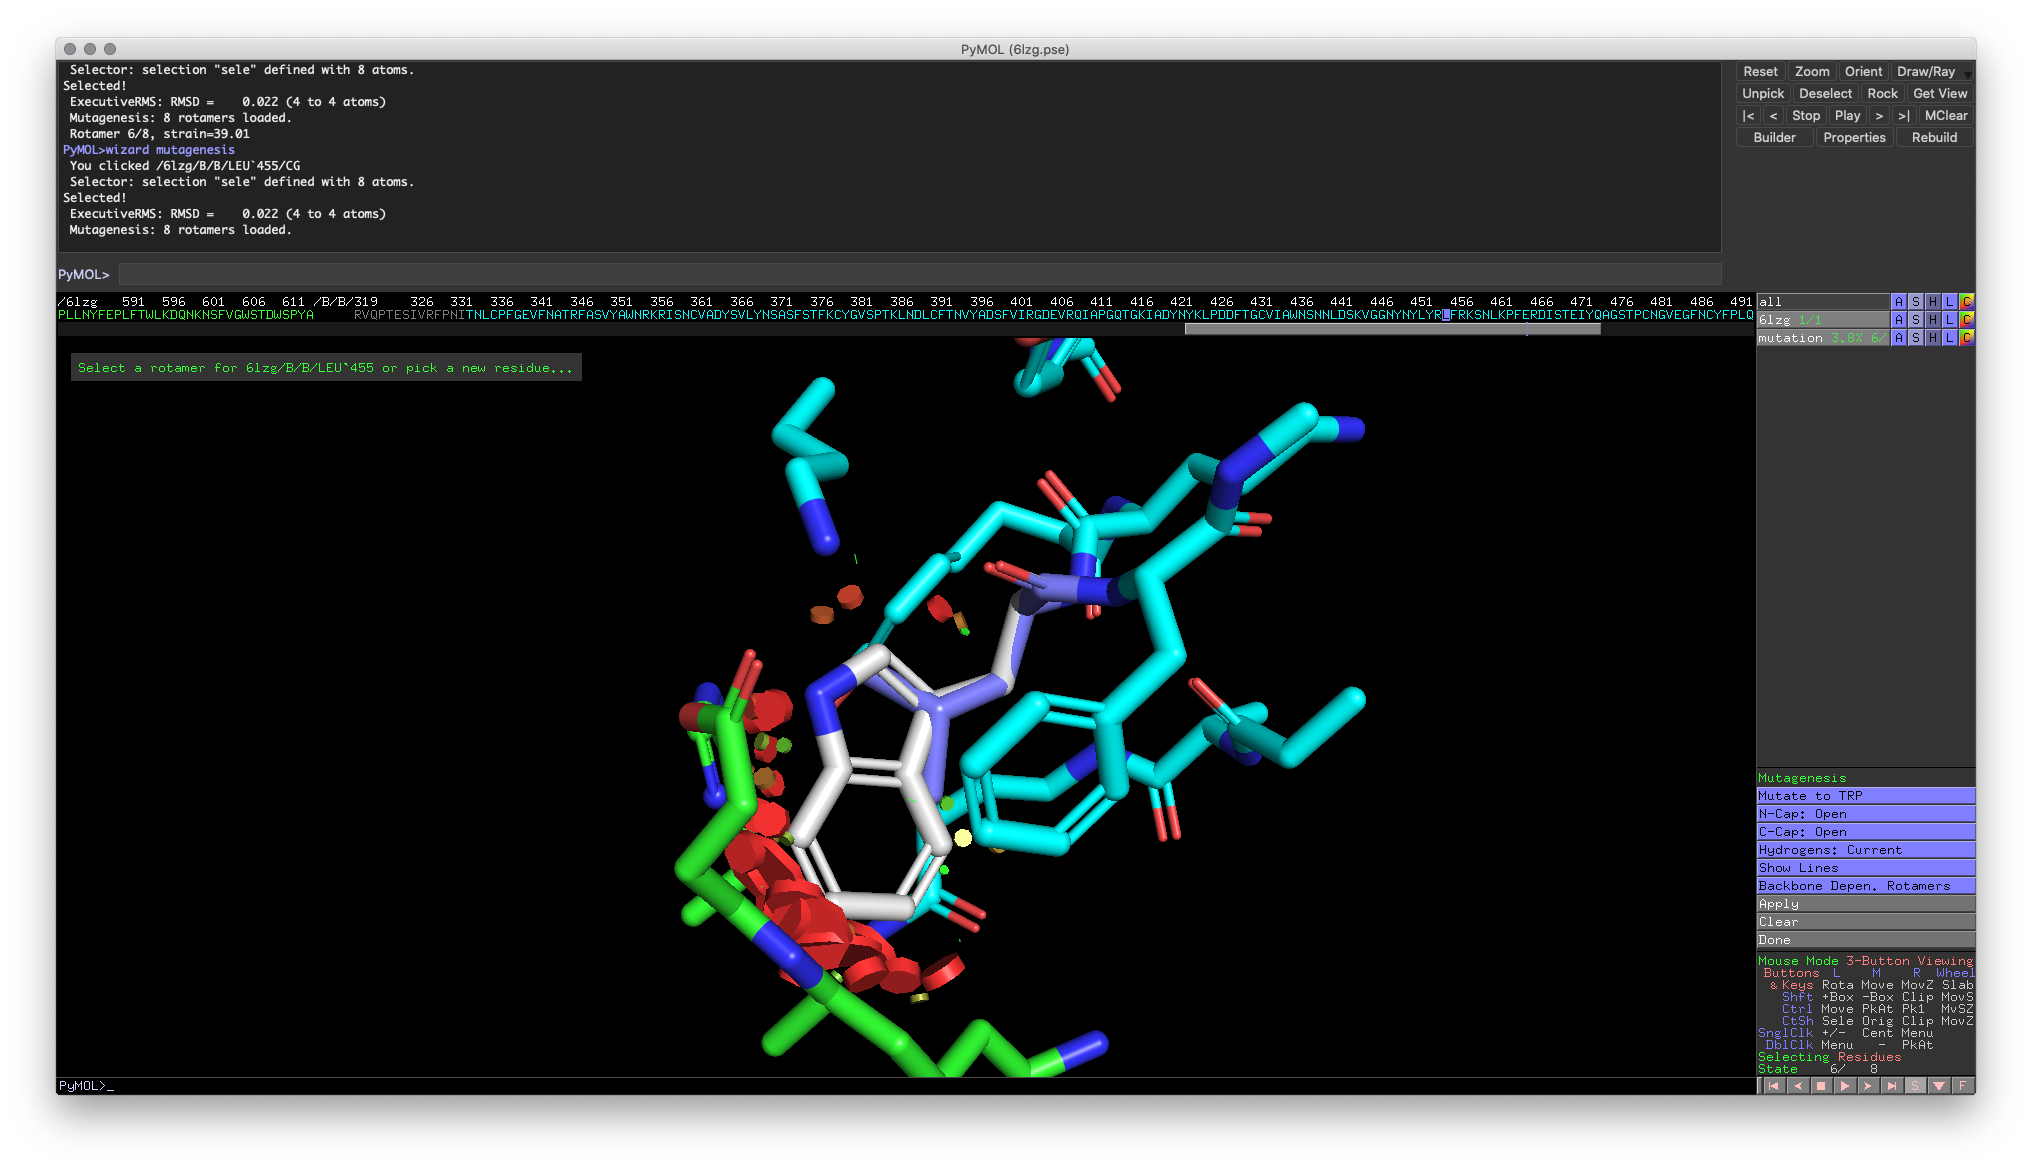 Fig 6: Visualization of a leucine to tryptophan mutation
In this model, there are three things to keep track of:
- The modeled mutation will be colored white
- The colored discs represent good (green) and bad (red) interactions generated by the mutation.
- PyMOL outputs a “strain” calculation that can be interpreted as a proxy for how favorable the mutation is. A higher strain indicates the specific mutation is not favorable.
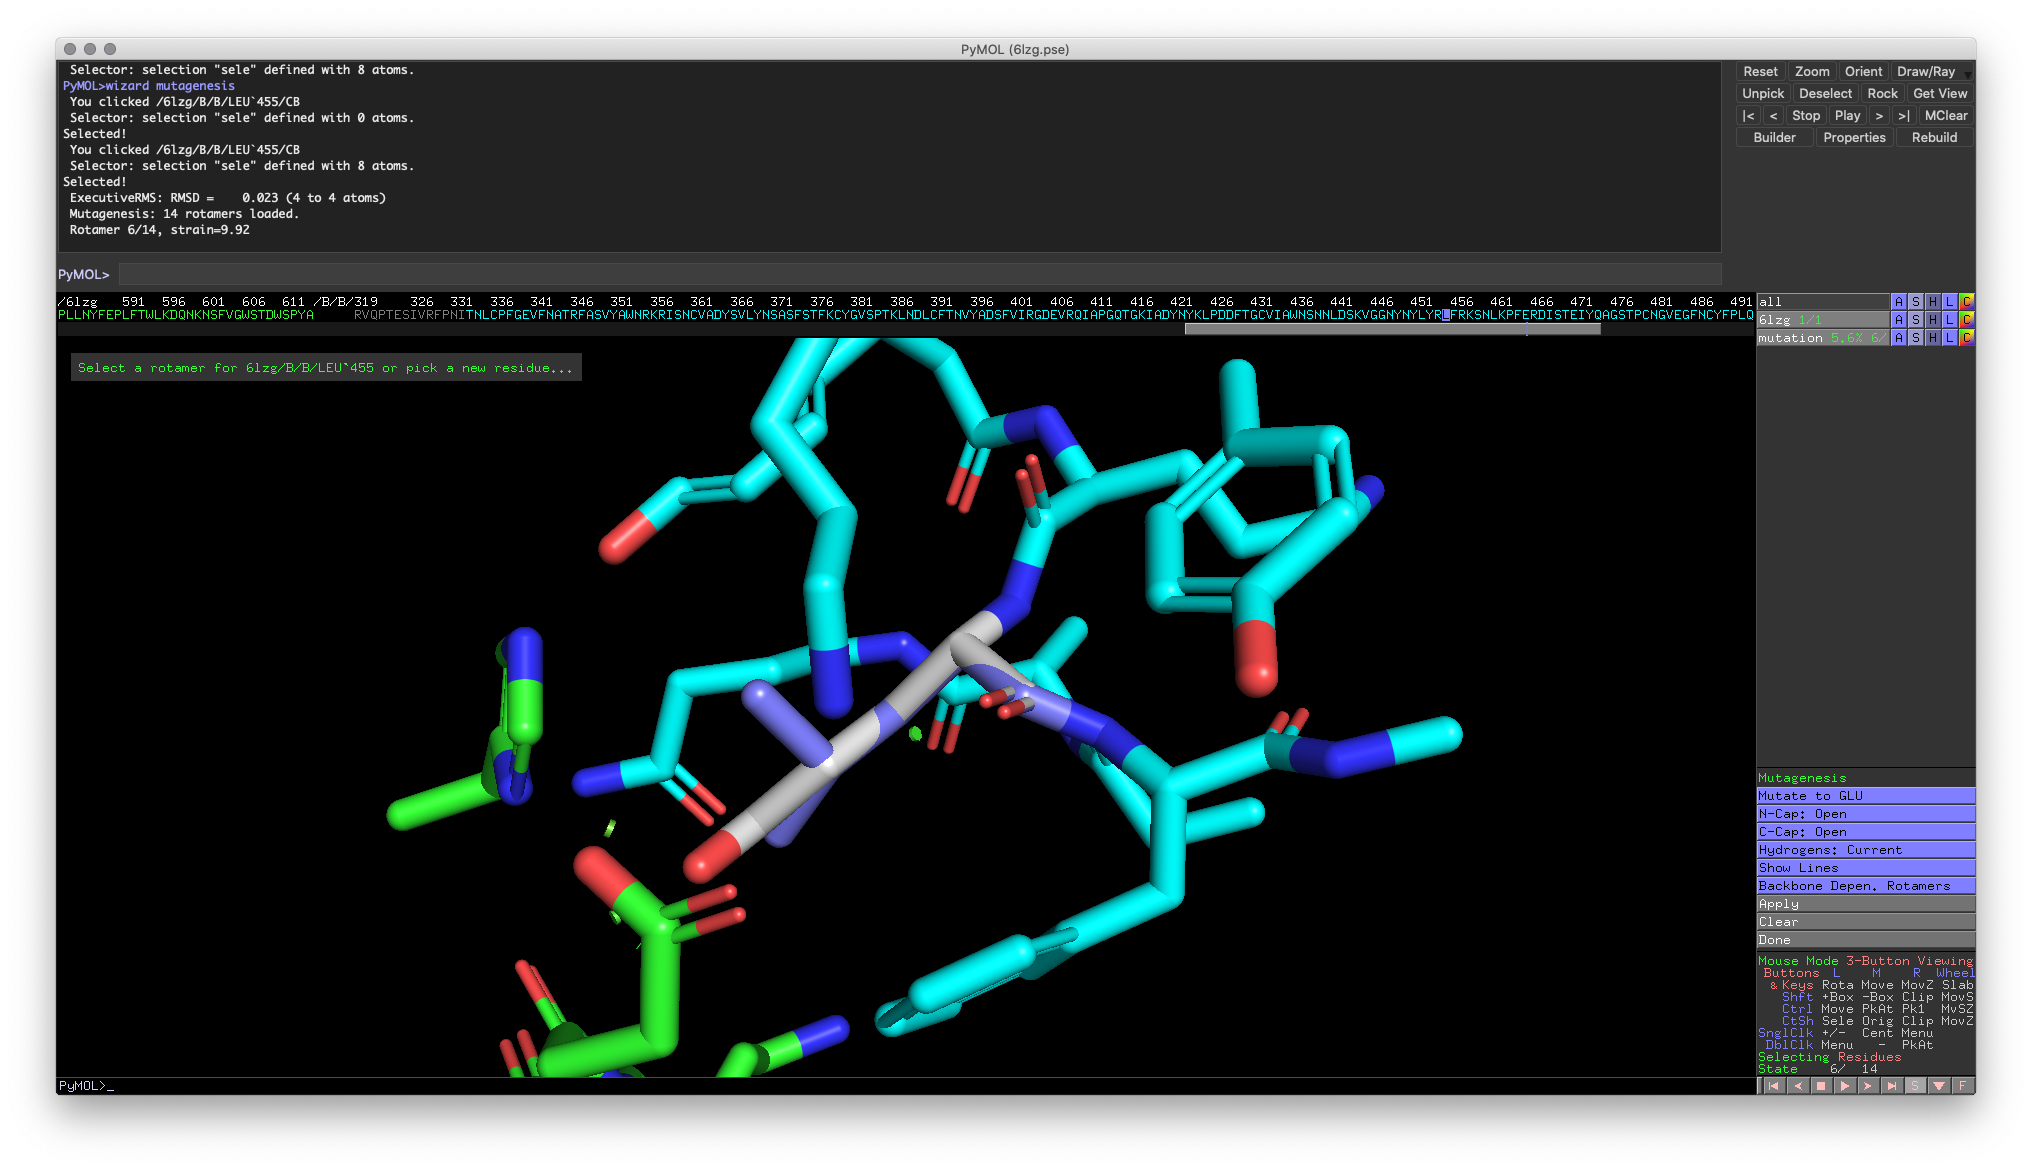
Additionally, PyMOL allows you to choose between a set of “rotamers.” Rotamers are different conformations of the same residue that are available due to rotations around bonds in the side chains. Some rotamers may shift the side chain and create significant clashes with surrounding atoms (Rotamer 7), while others allow the side chain to fit better (Rotamer 6). To cycle through the different rotamers, use the left and right arrow keys on your keyboard. To save the mutation, click on the “Apply” button and the residue.
A common problem that you may run into is that the interactions are only calculated within an object. If you didn’t get a new 6LZG object, you might see a mutagenesis view like the one below, where the clashes between the chains do not appear.
 Fig 7: Incorrect visualization of a leucine to tryptophan mutation due to chains being in separate objects
Hands-on Exercise 5: Find mutation for Leu455 (excluding glycine and alanine because they have small side chains) that would fit.
 Hands-on Exercise 6: Example of a good mutation (Glutamine)
Conclusion
Congratulations! You have now completed Part 2 of the PyMOL Beginner’s Guide. You now have the skills to tackle even more complex modeling problems, including creating mutation hypotheses and exploring binding surfaces.
While PyMOL is a powerful modeling tool, you may have to use more powerful alternatives. Rosetta is one of the leading modeling tools for protein structure prediction and can be used for evaluating how a structure responds to different mutations. Maestro is similar to PyMOL, but provides additional functionality for high-throughput ligand binding simulations and other tools.
For proteins made up of multiple polypeptide units that are not identical, the individual subunits are referred to as protomers. You may be familiar referring to this as a monomer, but this term is reserved for the situation when each unit is identical.↩
Wrapp, Daniel, Nianshuang Wang, Kizzmekia S. Corbett, Jory A. Goldsmith, Ching-Lin Hsieh, Olubukola Abiona, Barney S. Graham, and Jason S. McLellan. 2020. “Cryo-EM Structure of the 2019-NCoV Spike in the Prefusion Conformation.” Science 367 (6483): 1260–63. https://doi.org/10.1126/science.abb2507.↩
Wang, Qihui, Yanfang Zhang, Lili Wu, Sheng Niu, Chunli Song, Zengyuan Zhang, Guangwen Lu, et al. 2020. “Structural and Functional Basis of SARS-CoV-2 Entry by Using Human ACE2.” Cell 181 (4): 894-904.e9. https://doi.org/10.1016/j.cell.2020.03.045.↩